Two sensing problems. Separate setups. A development loop that turns measured behavior into the next firmware or algorithm candidate.
Hao-Yen Tang’s engineering work at UltraSense · October 14–21, 2026
2 development tracks
Separate physical setups · October 14–21
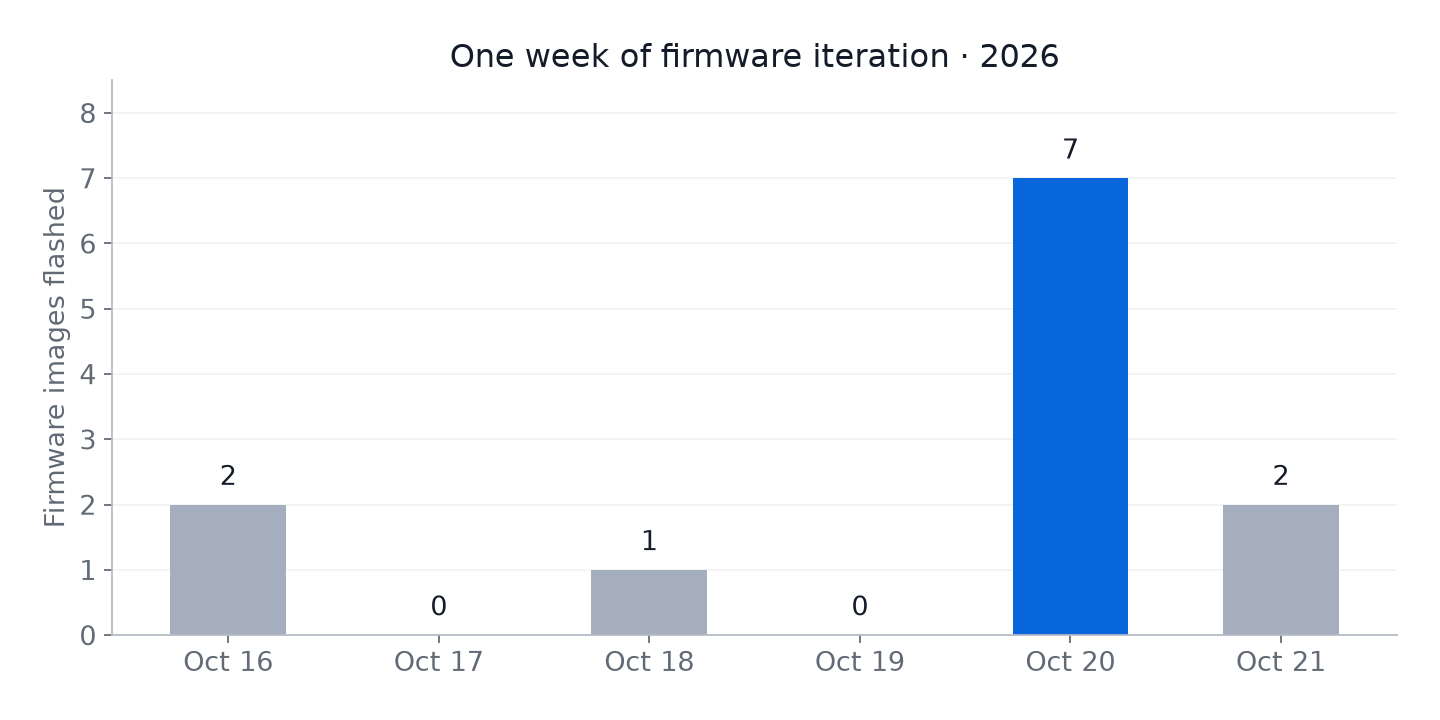
7 firmware images in one day
Force sensing · October 20
27 filters compared
Recorded ultrasonic data · offline study
A sensing algorithm needs repeated contact with the physical world. The useful change is to connect AI to the code, instruments and test procedures—then let separate setups carry separate lines of investigation forward.
Shared knowledge. Independent physical setups.Engineering goals · company knowledge · code and test methods
Setup A / Force sensing
Stable force output and reliable press detection
DevelopCandidate algorithms and firmware
MeasureAutomated press rig and reference force
ComparePress detection, drift and false triggers
Firmware iteration and repeatable press campaigns
↻ Results guide the next candidate
Setup B / Ultrasonic sensing
Better signal quality within a processing budget
DevelopFiltering, calibration and firmware
MeasureSeparate sensing board and capture interface
CompareRecorded signal quality and processing cost
Filter research followed by firmware integration
↻ Results guide the next candidate
Concept workflow based on the two development tracks. Engineers set objectives, prepare hardware and choose tradeoffs.
Each physical setup is an independent development resource. Sessions sharing one rig take turns controlling it.
Keep experiments running beyond the workday.
Automated campaigns continue through configured test conditions between engineering decisions, so the next workday starts with fresh measurements and comparisons.
Hardware gives the loop something real to learn from.
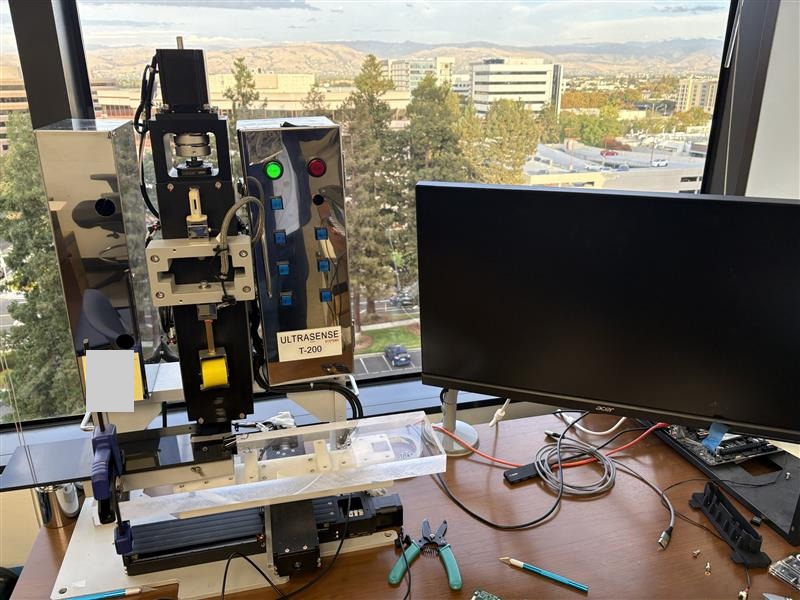
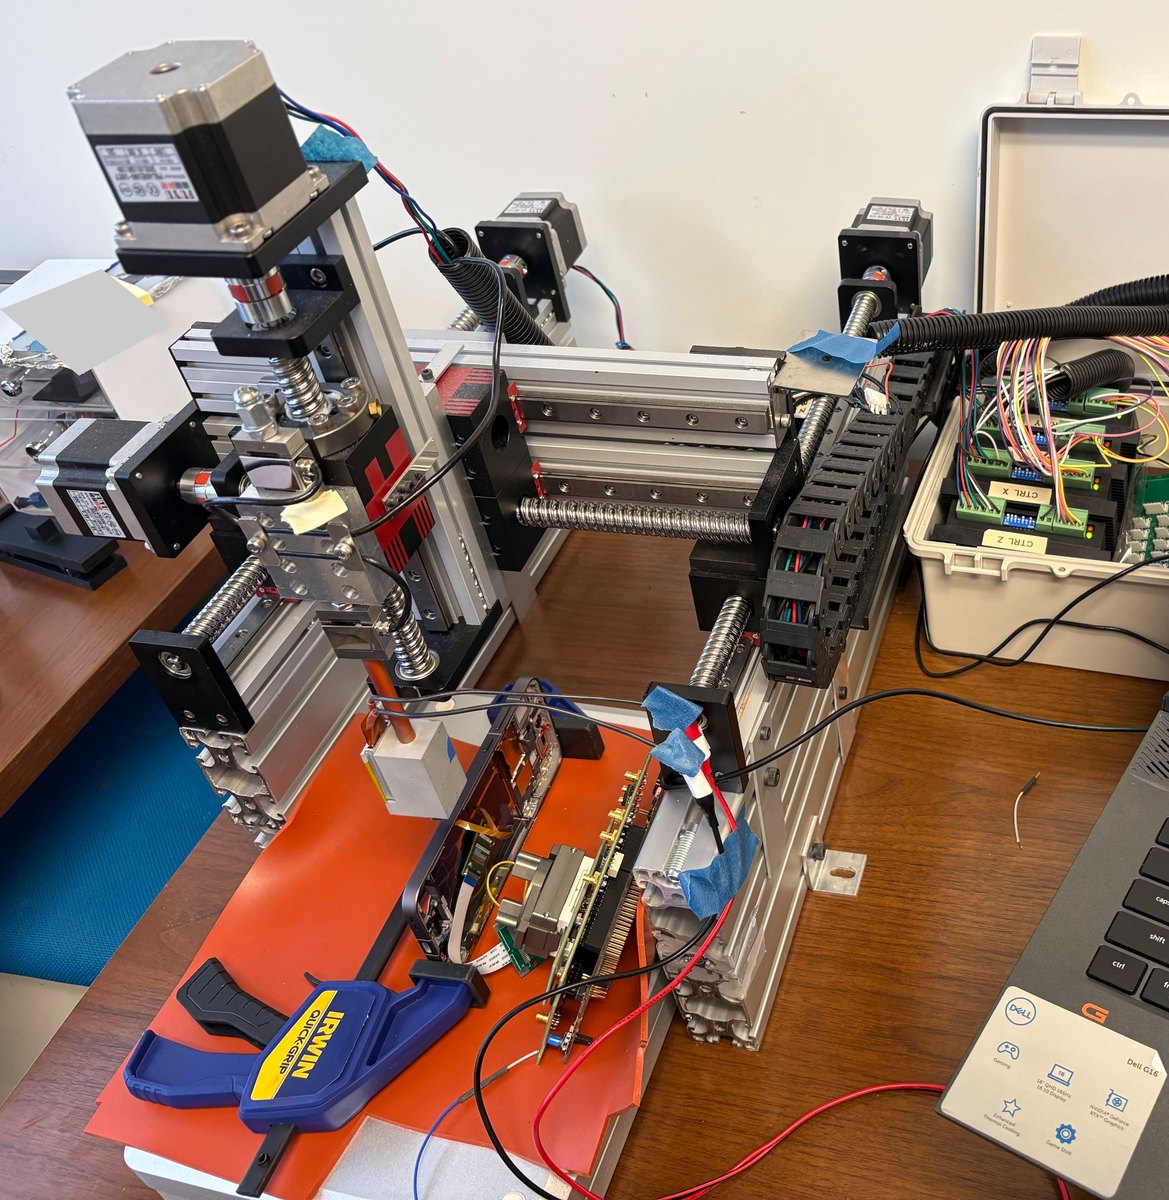
An automated press platform and a multi-axis test platform connect fixtures, sensors and control electronics to repeatable physical experiments.
Automated press platform and work area.Multi-axis test platform, sensor fixture and control electronics.
One question becomes the next experiment.
Set the objective
Choose the behavior and the measurement that will show improvement.
Develop a candidate
AI works with the existing code, knowledge and recorded data.
Check and measure
Run software checks, load the firmware and execute the supported test.
Review and repeat
Compare the measurements, choose the tradeoff and refine the next candidate.
Force sensing / firmware meets repeatable measurement.
The force-sensing track connected firmware development to an automated press rig. Seven firmware images were flashed on October 20. Separate in-air soak tests tracked stability as the algorithm evolved.
Firmware iteration
Force-sensing track · October 16–21, 2026. Daily counts of firmware images flashed. October 16 covers the afternoon after rig activation; morning manual images are excluded.
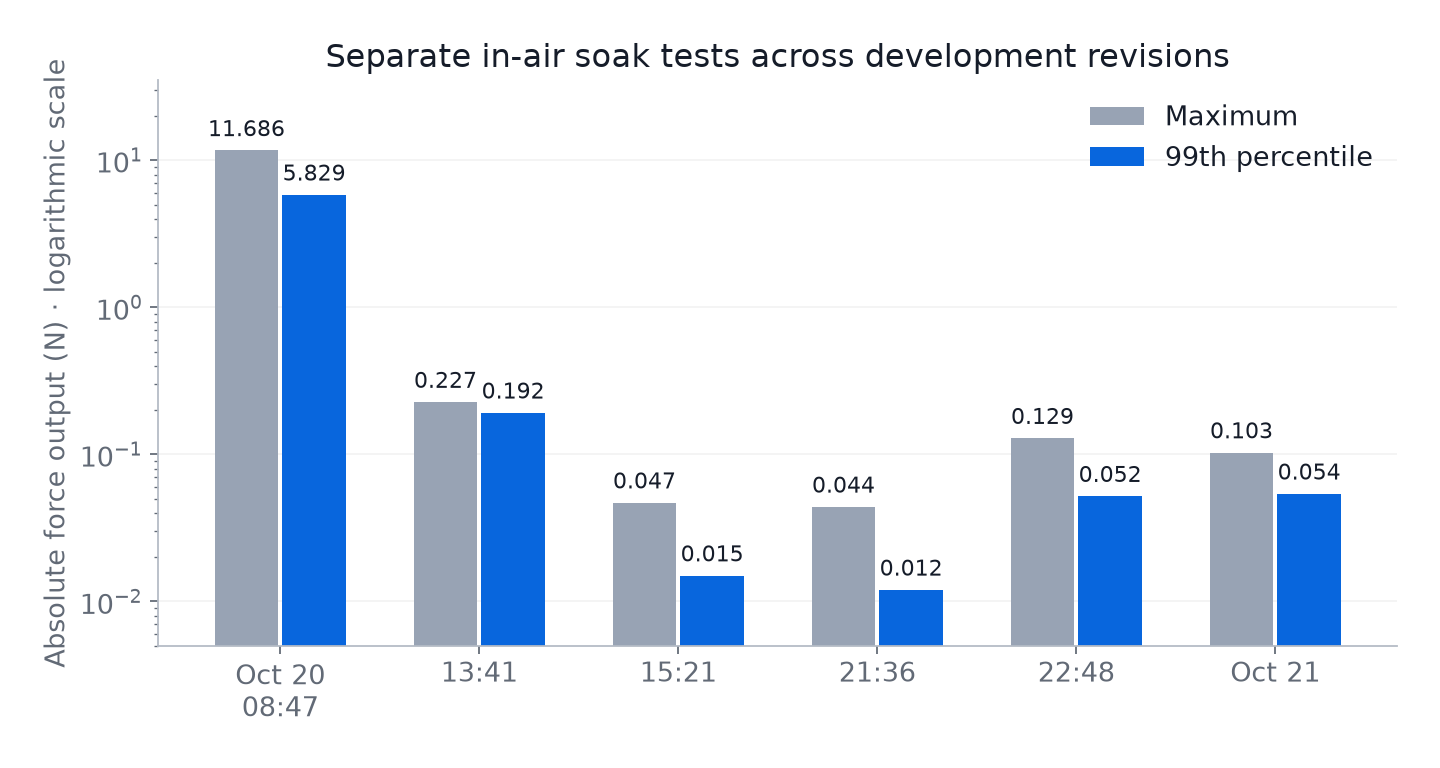
The reported 99th percentile of absolute force output fell from 5.829 N to 0.054 N across the shown development revisions. These separate in-air soak tests used different durations and tracked output stability while the probe was unloaded.
In-air output stability
Separate on-chip in-air soak tests · October 20–21, 2026. All six reported maximum and 99th-percentile values, with a logarithmic force axis.
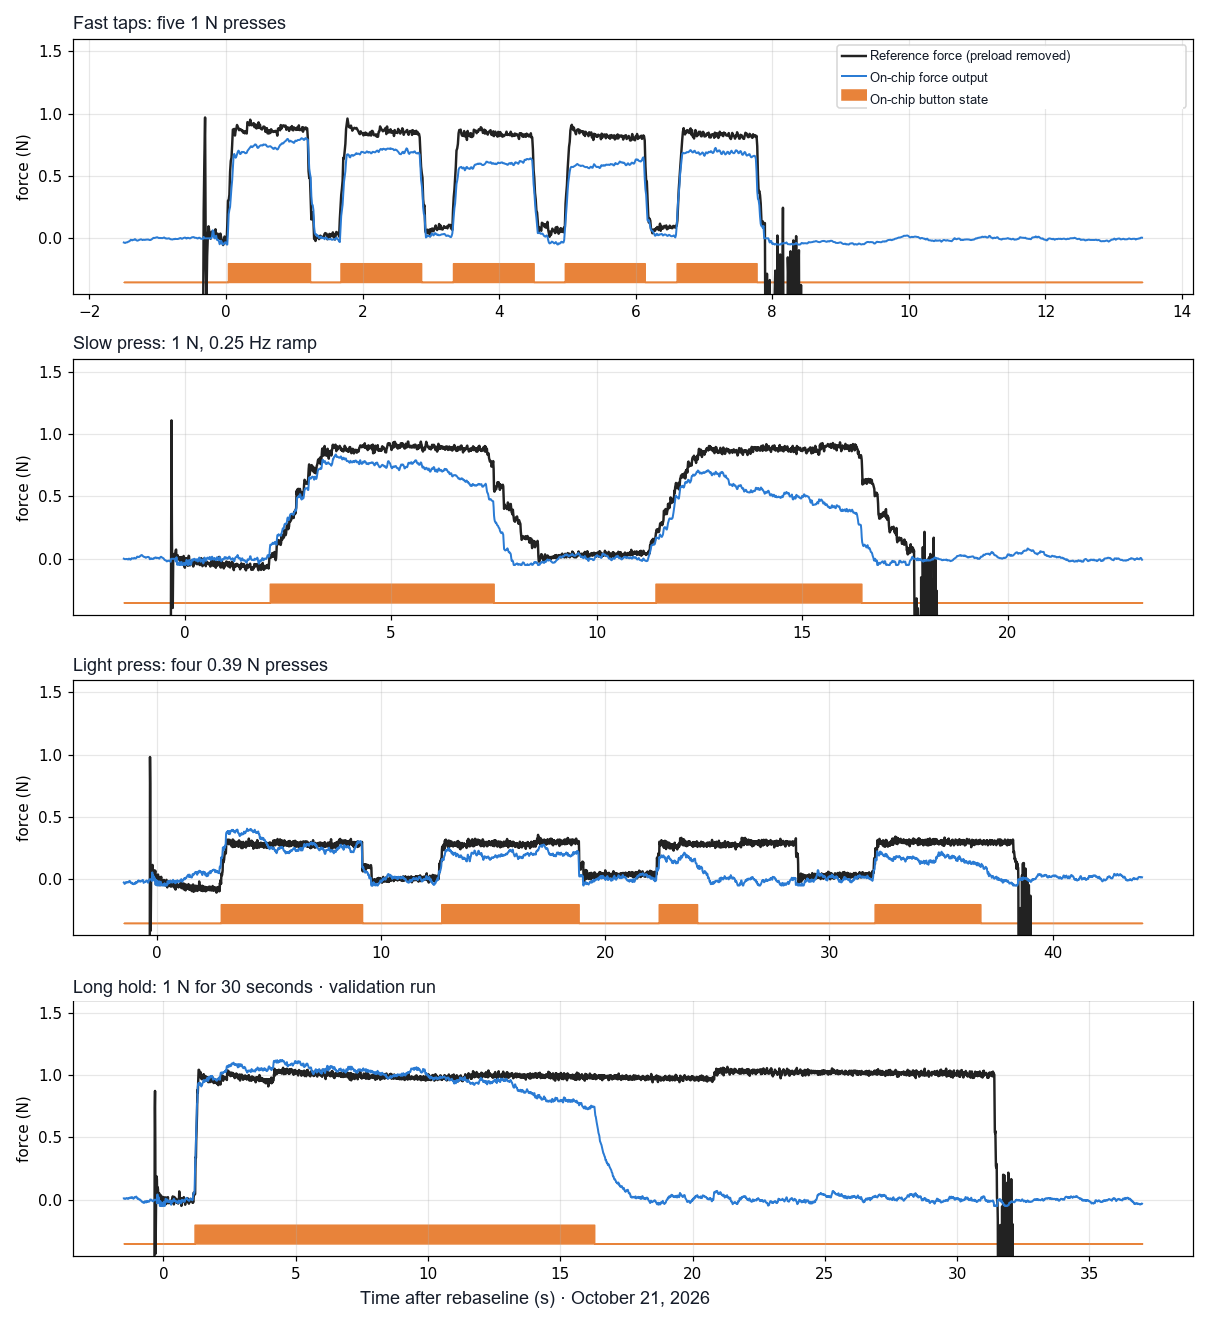
In the selected 10-round campaign, all 200 presses at or above 0.5 N were detected, with no false triggers reported in that campaign. It comprised 90 press runs and 10 soak tests. A later, broader validation found a missed first press and an early release during a light long hold.
The four recorded examples show fast taps, a slow ramp, light presses and a 30-second hold. The light-press example sits near the detection boundary. During the long hold, the output decays and the button releases at the configured 15-second limit.
Measured press behavior
On-chip force-sensing measurements · October 21, 2026. Fast taps, slow presses, light presses and a long hold. Black: reference force; blue: chip output; orange: detected button state.
Ultrasonic sensing / compare options before spending chip time.
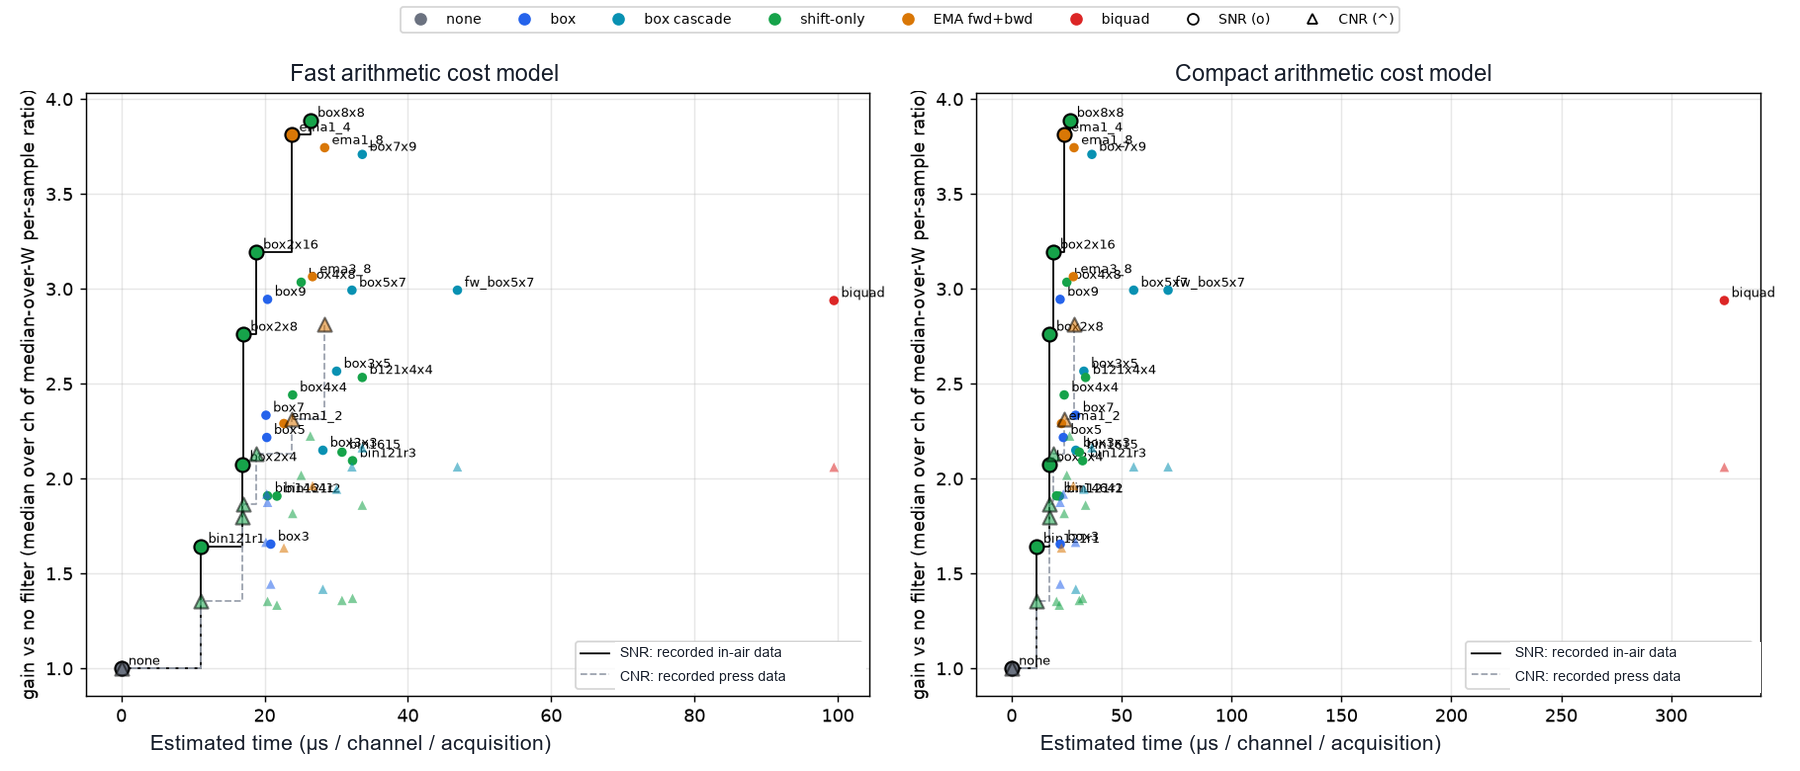
The ultrasonic track compared 27 filters on recorded chip data, considering signal quality and estimated processing cost. A filter feature was merged into firmware the day after the study.
Signal quality and processing cost
Ultrasonic track · October 20, 2026. Offline filter comparison on recorded chip data. Signal-quality ratios are relative to no filtering; estimated CPU time is per channel per acquisition.
Recorded-data comparison; CPU time is estimated under two arithmetic-cost assumptions. The integrated feature was measured separately at an additional 31 µs per channel in firmware.
Build the capability inside your team.
Start with one repeatable engineering task. Connect the knowledge, code and equipment, agree the checks and leave the team with a workflow it can use. Extend to another independent setup when the next experiment calls for it.